Chart of the Month
APSA’s Chart of the Month visually highlights key research findings and provides insights into other issues of relevance to the political science profession. Published each month since June 2016, Charts cover topics from teaching resources and undergraduate curriculum to eJobs and graduate placement. If you are interested in the data underlying these visualizations, please look at our public datasets page, or submit a data request form here.
See this month’s chart below. To view Charts from previous months, click here or scroll down the page. Have questions or can’t find a specific chart? Email us at surveys@apsanet.org.
June 2026 Chart of the Month
Click here to view the chart as a larger image.
Click here to view the chart as a pdf.
Previous Charts of the Month
Click on a Chart’s title or image below to open it in PDF/PNG form.
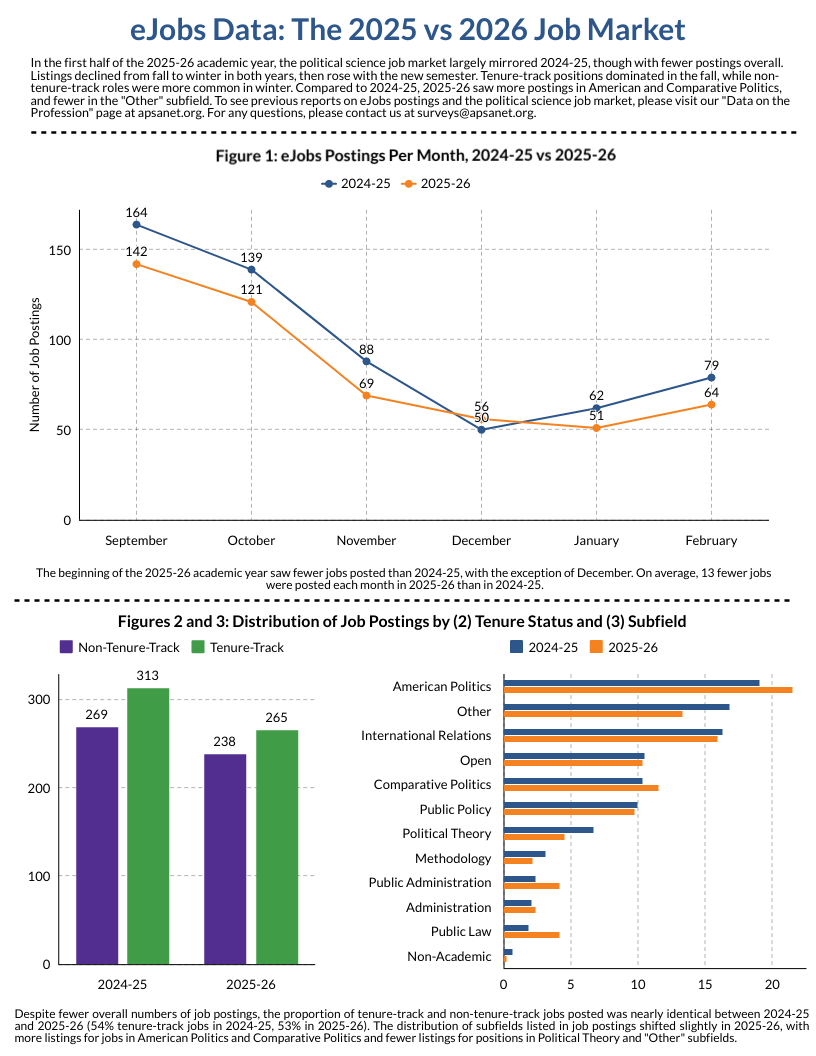
2025-2026 eJobs Data Comparison
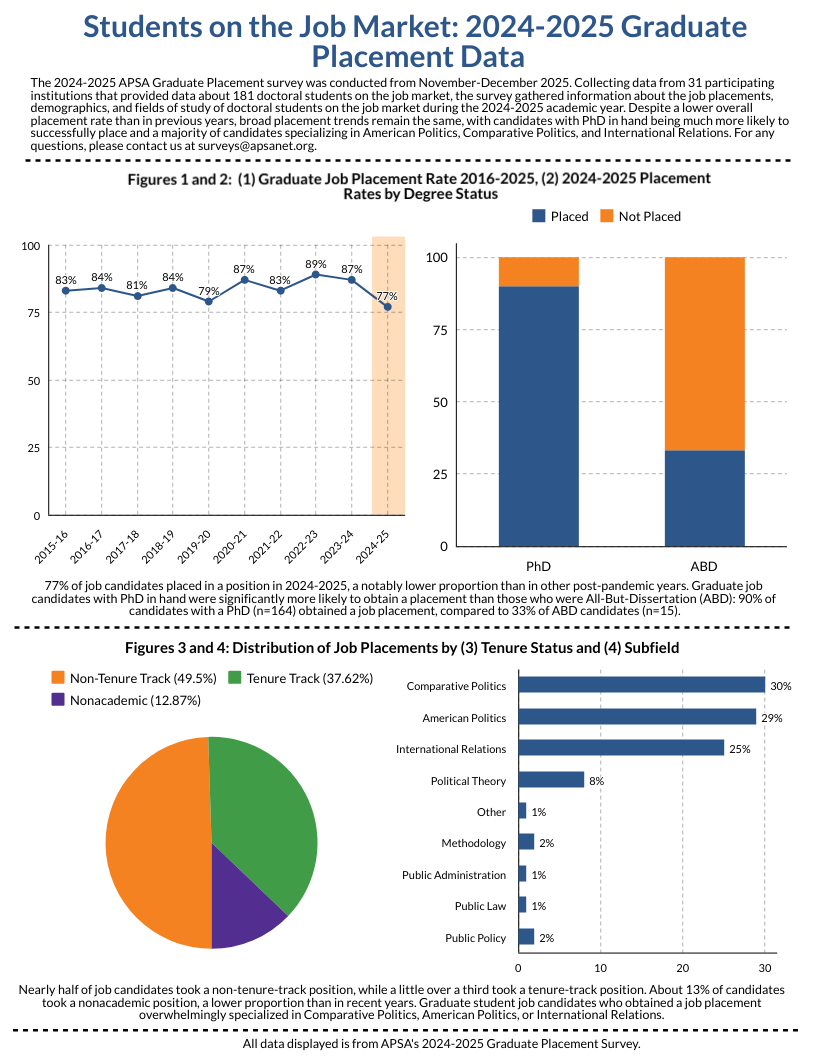
2024-25 Graduate Placement Data
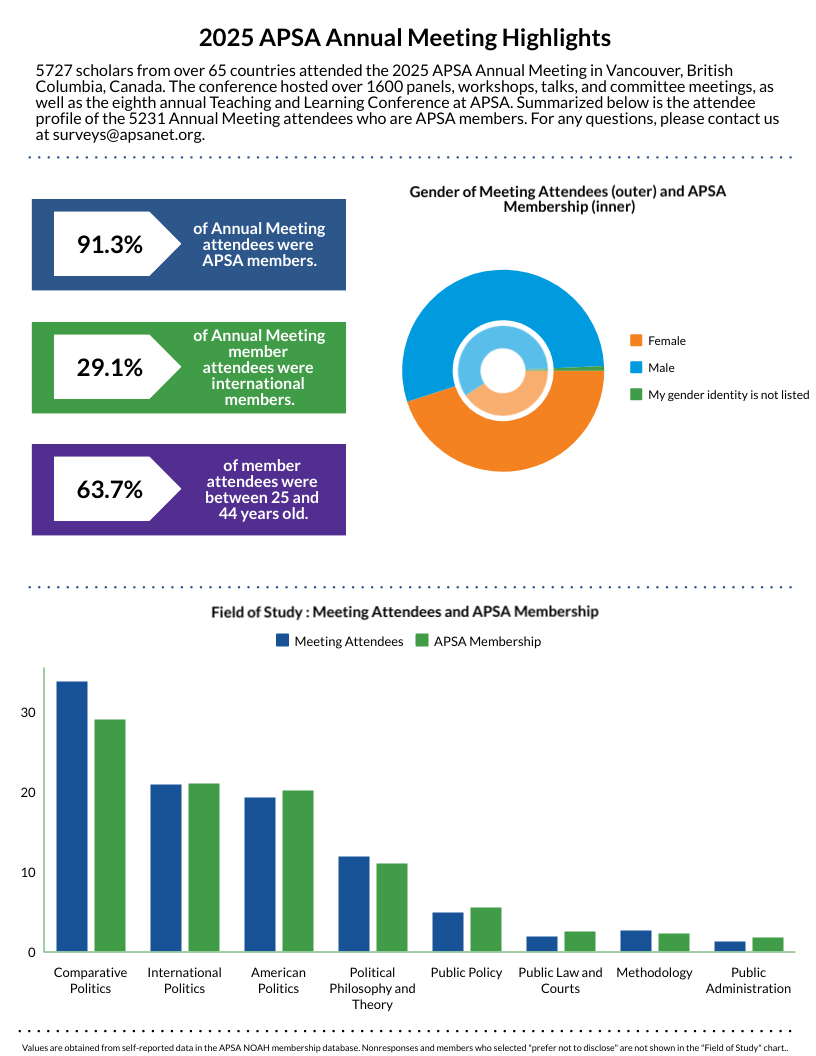
2025 APSA Annual Meeting Highlights
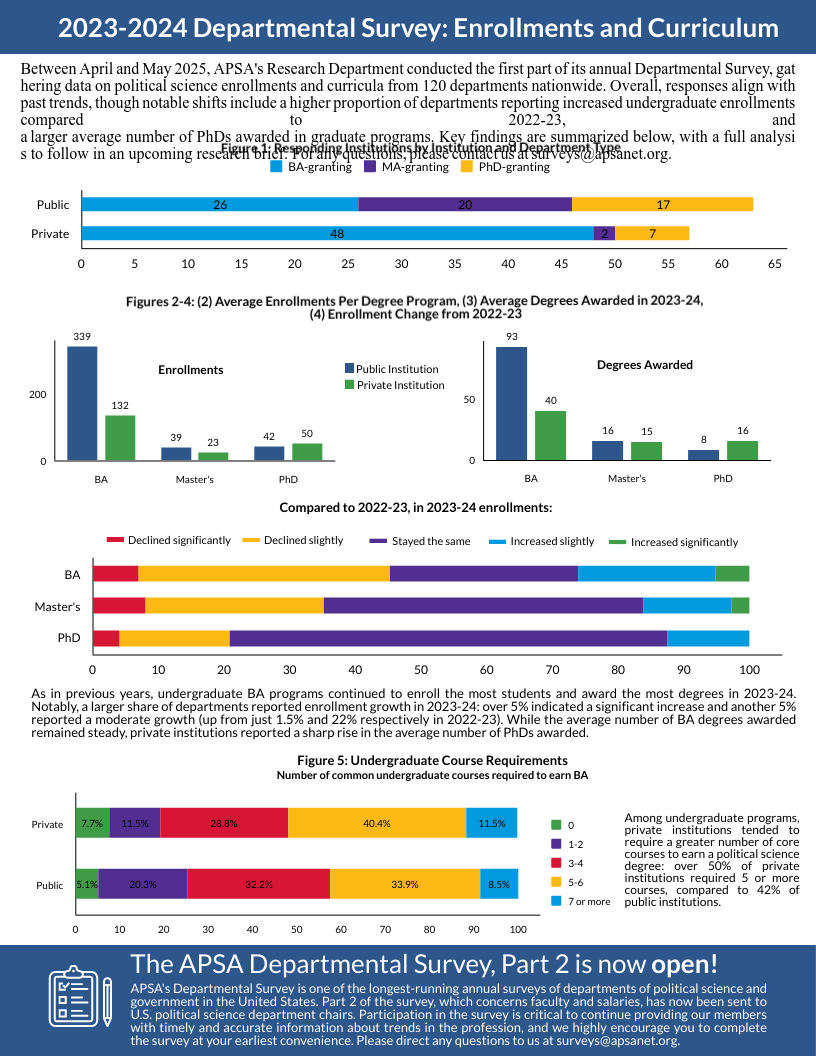
2023-24 Departmental Survey: Enrollments and Curriculum
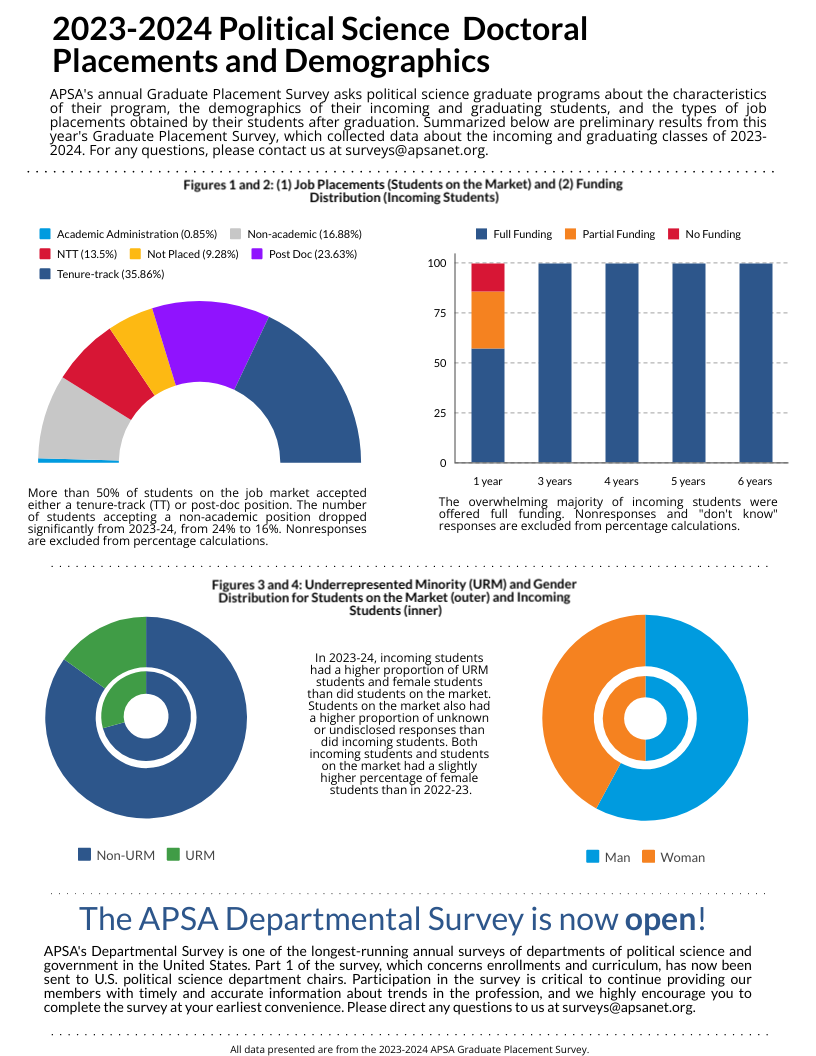
Graduate Placement Survey: 2023-24 Doctoral Placements
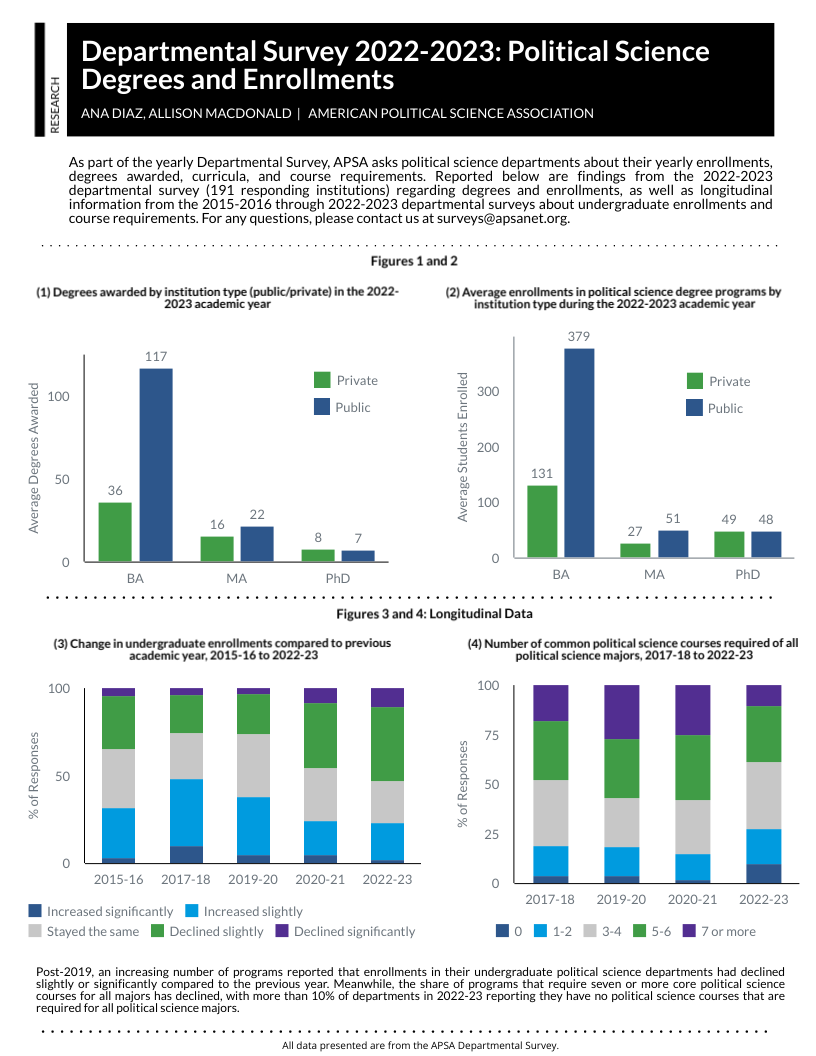
Departmental Survey: Degrees and Enrollments
Incoming Graduate Student Profile


Incoming students Funding Status 17-18

Incoming students Funding Status 17-18

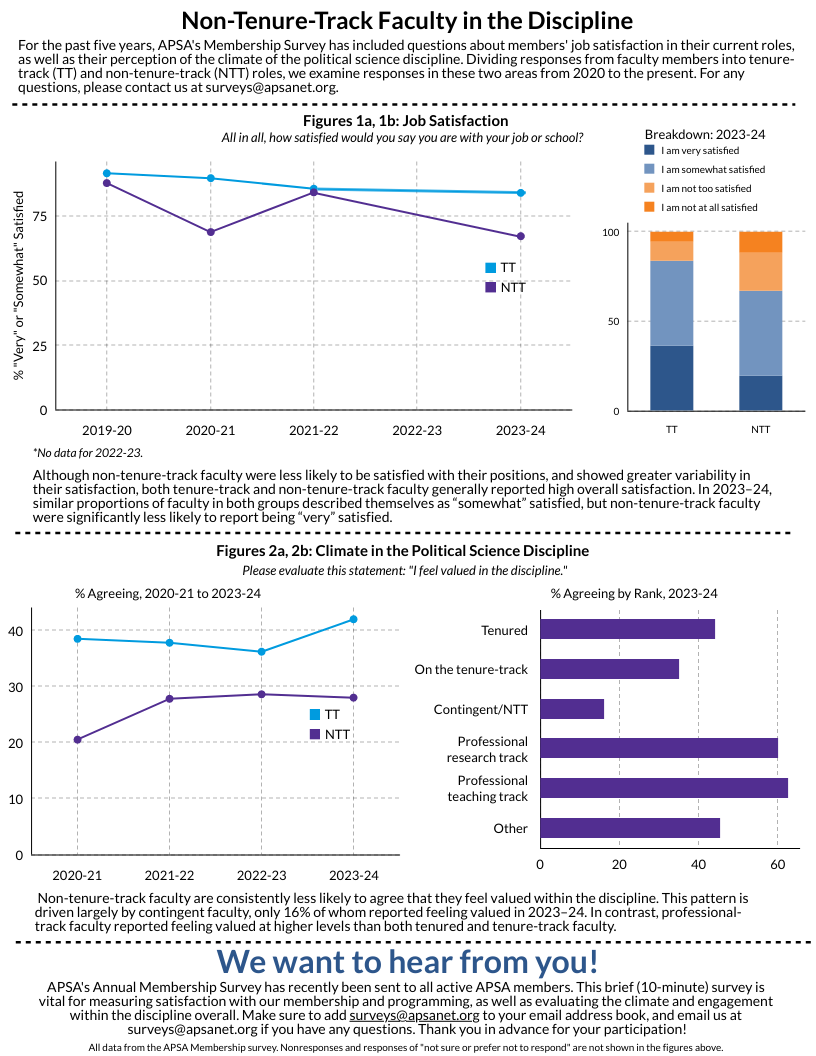
Non-Tenure-Track Faculty in the Discipline
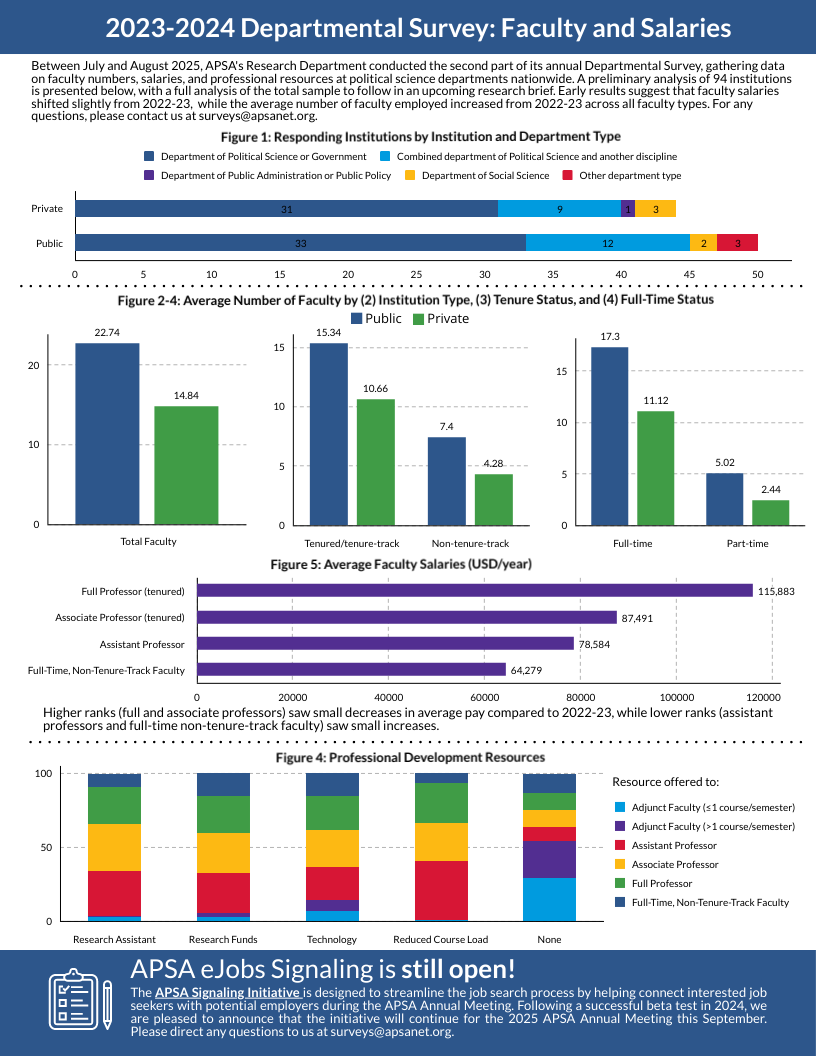
2023-24 Departmental Survey: Faculty and Salaries
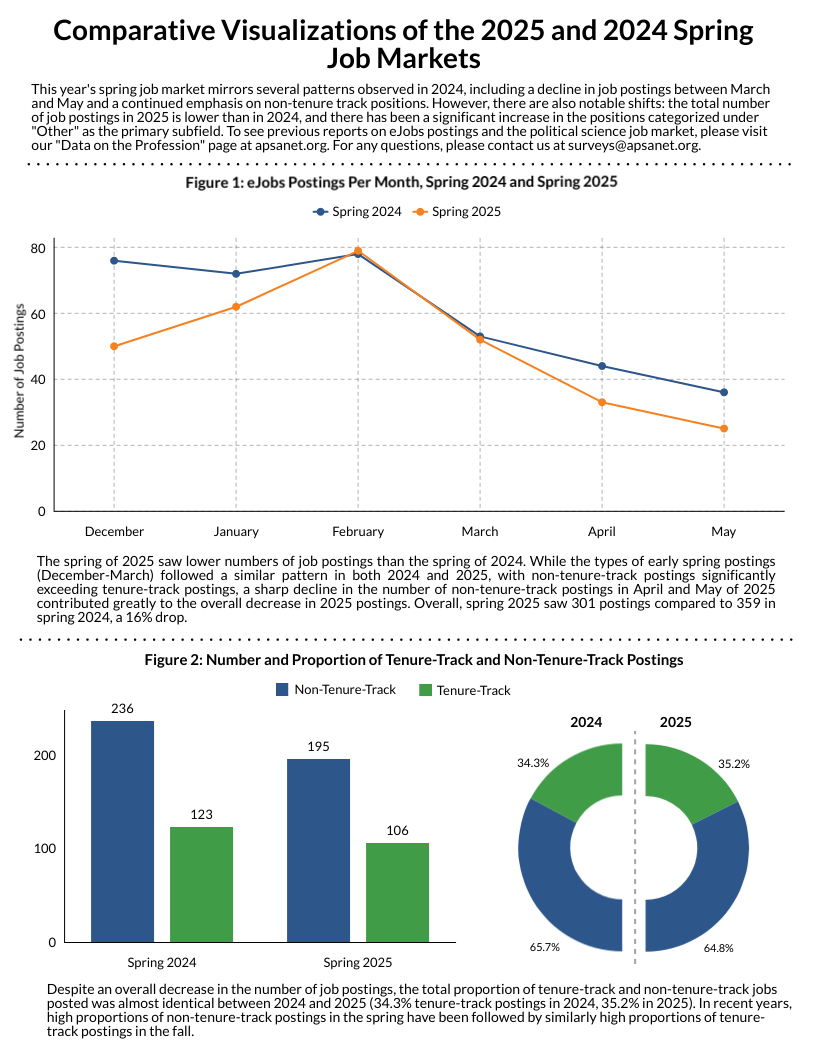
eJobs: Spring 2024-2025 Comparative Visualization
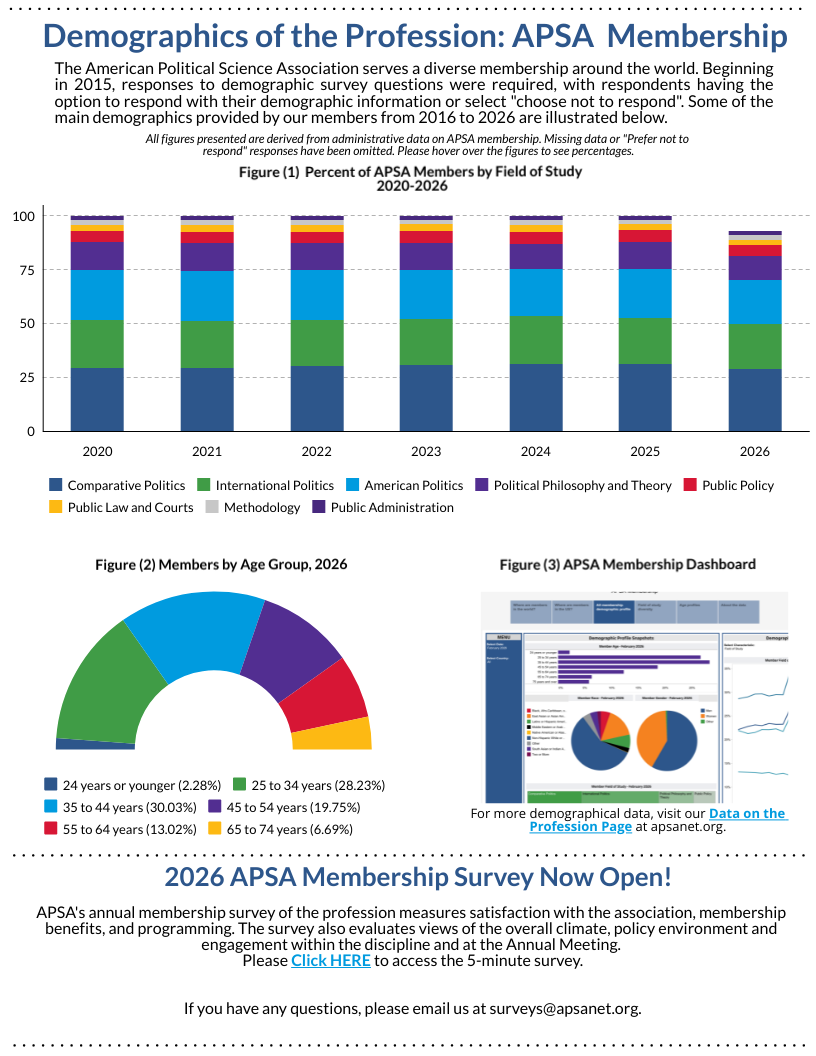
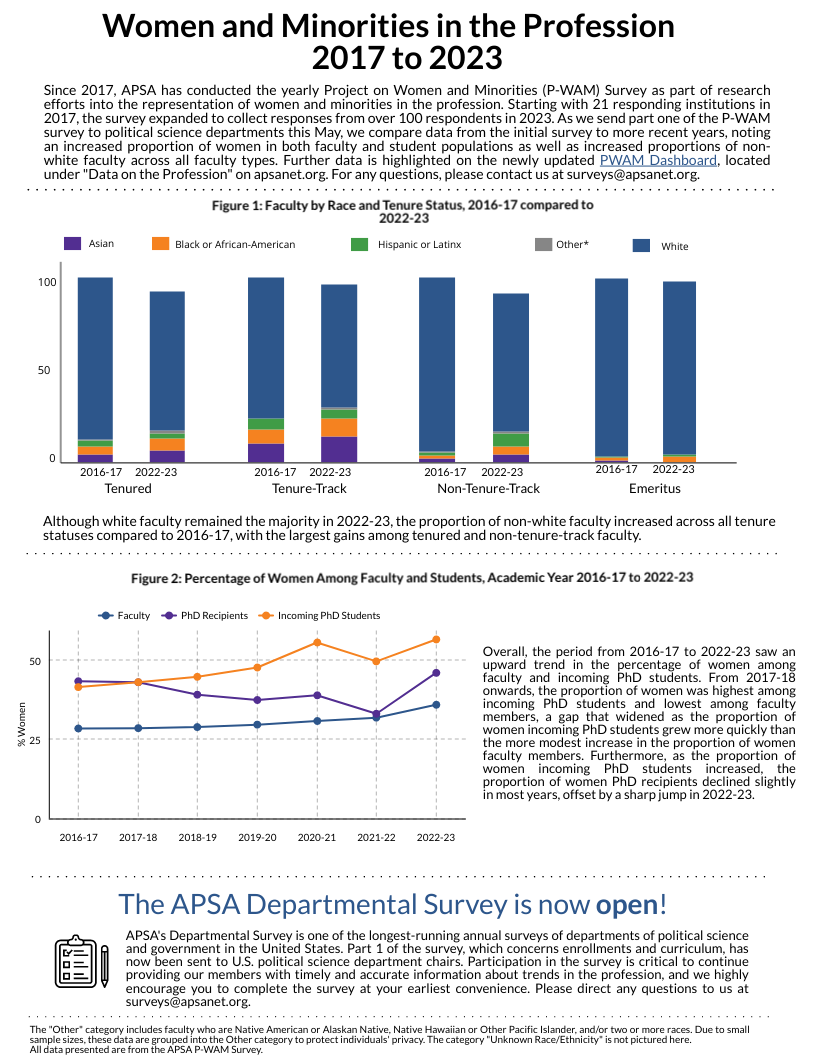
P-WAM Survey: Faculty and Student Demographics
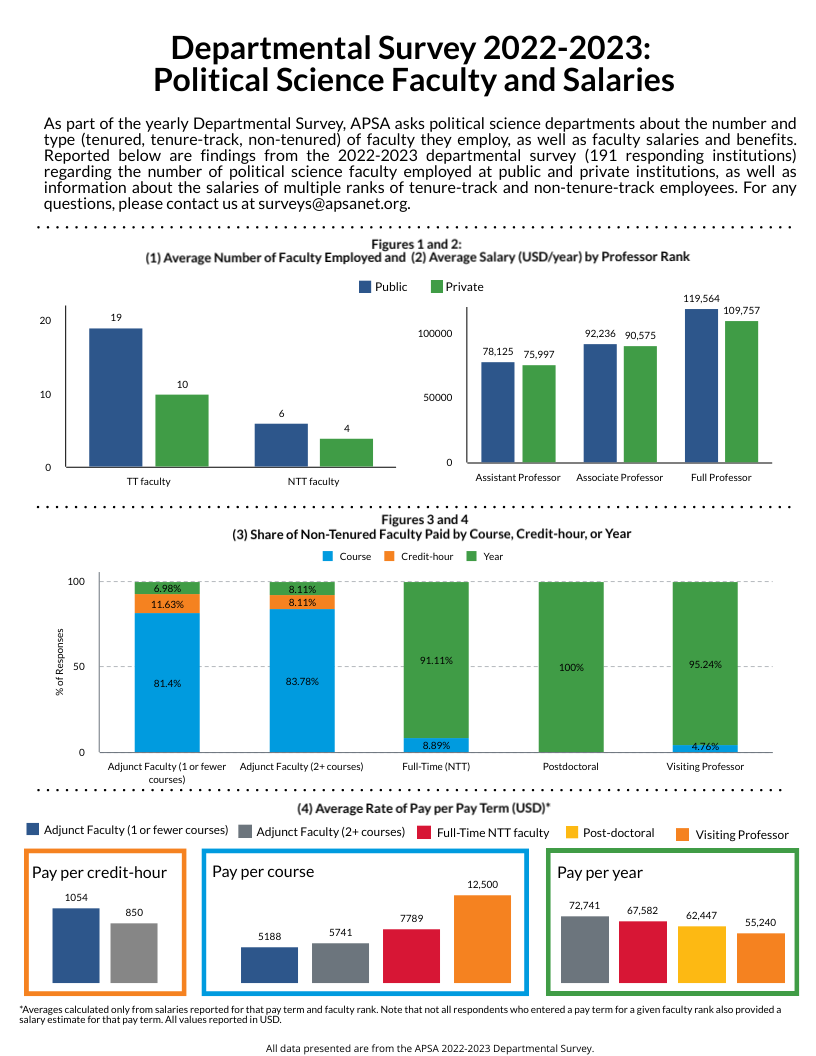
Departmental Survey: Faculty and Salaries

Gender, Race, and Ethnicity within APSA’s Organized Sections

Graduate Students on the Market 2021-2022

2022 Annual Meeting Attendees Profile